Okay,
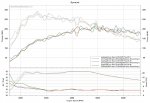
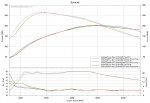
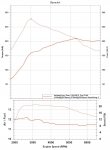
Below are two of my datalogs graphed out with Virtual Dyno. One is my COBB OTS Stg3 91 and the second is my Freektune Revision 3 (current tune). Both tunes are charted on the same graph for comparison and I have provided graphs in both SAE and STD as I see a lot of postings of STD graphs from real dyno shops, which tend to read a little higher. My Virtual Dyno "custom" 2014 Fiesta ST has the specs as below:
-Weight (Freektune): 3082, Weight (COBB): 3068...these are based on my weight, fuel (full tank on both runs), items in car and the clothing I was wearing all added to the curb weight.
-Drag Coefficient: .32
-Frontal area: 22.90
-Tire diameter: 23.46
-3rd Gear and Final Drive ratio: 1.357 and 3.820 (datalog was completed in 3rd gear/ Manual trans)
-I used:
http://www.friendlyforecast.com/archive_portal/archive.php to get my outside temp and pressure.
-I used the smoothing: 1 (I also tried smoothing: 3, which smoothed it out a lot and dropped the peak horsepower by 3 on both runs...same with the torque.
-Fairly flat road and around 100 ft above sea level.
-86 degree F for the Freektune and 90 degrees F for the Cobb.
The Freektune that you see here was not my highest peaking Freektune Revision but it is the smoothest and best driving. There may not be an impressive gain in peak horsepower here, but the torque gain and gains elsewhere are very noticeable and in the perfect spots for the way I drive. Below are the graphs:
STD:
View attachment 2162
SAE:
View attachment 2163
Next thing is to run a couple more of these then to get to a real dyno and compare.

