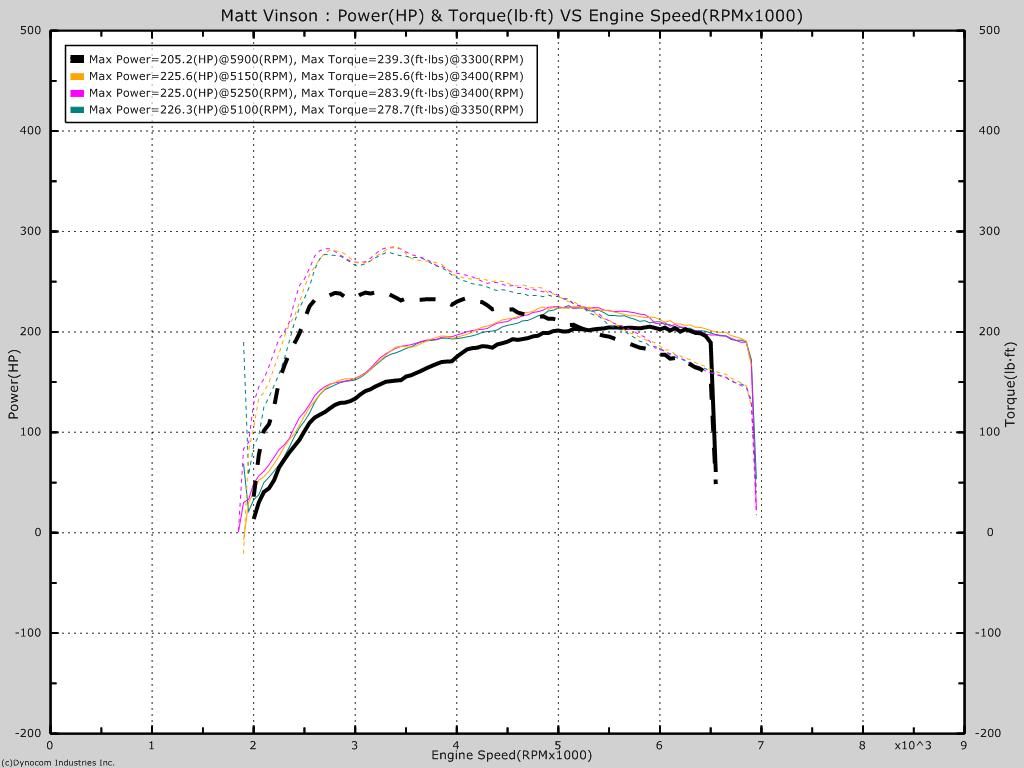
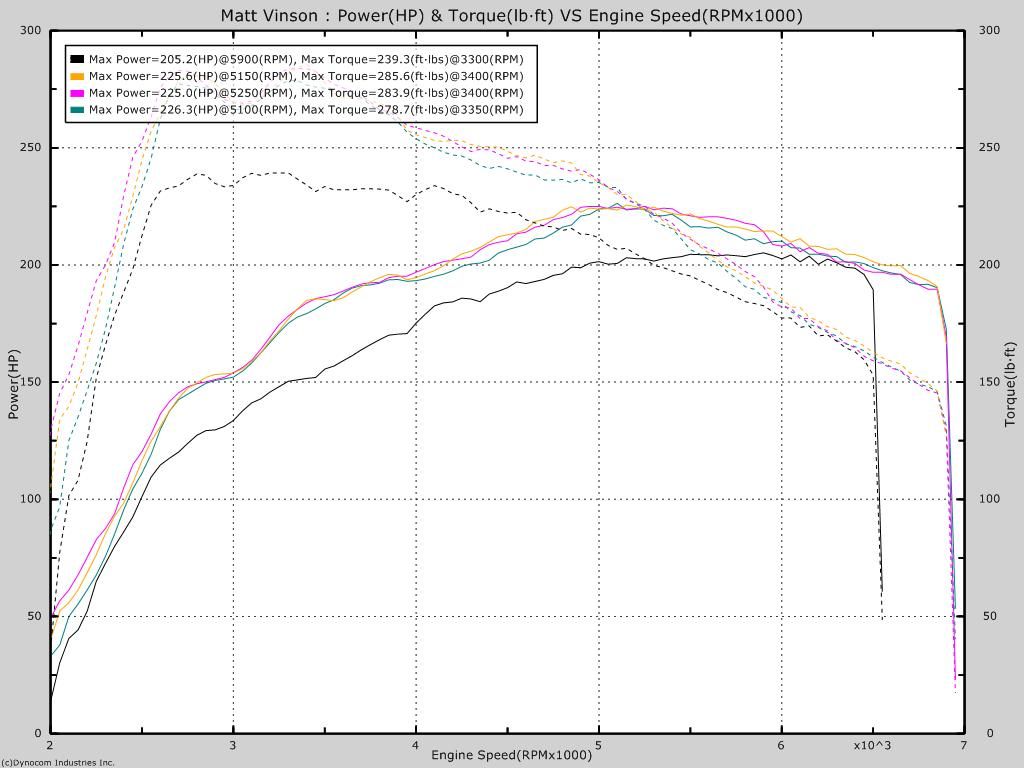
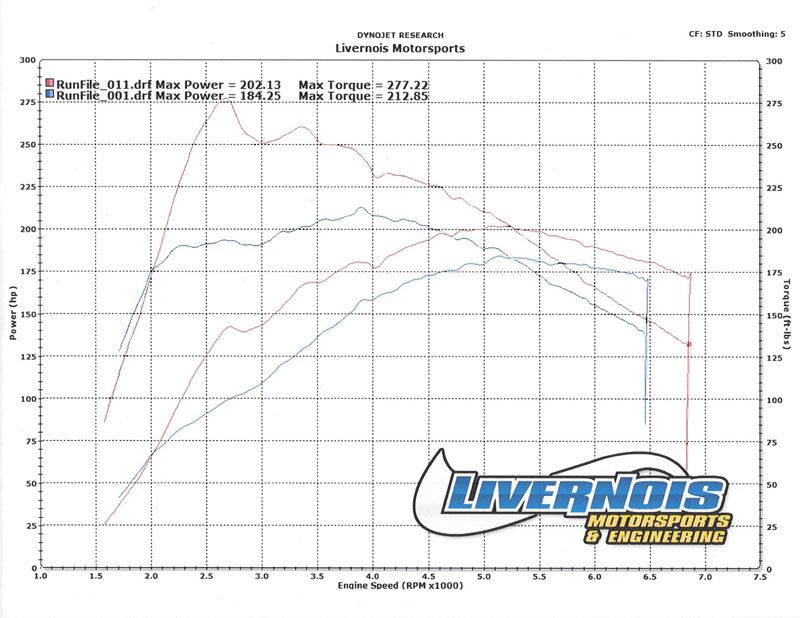
So in light of what you were saying, can you state what's wrong with my graph?
My lines from today are almost identical in linear motion to that of my stock pulls. So if you could explain more of what I'm supposed to be looking for it would be most appreciated.


My lines from today are almost identical in linear motion to that of my stock pulls. So if you could explain more of what I'm supposed to be looking for it would be most appreciated.


Edit: these seem to be the same pulls. So, scrap my new graph wording.

